In 1985, satellite instruments measuring ozone over Antarctica registered readings so low that the processing software flagged them as instrument errors and filtered them out. The hole in the ozone layer was in the data for years before anyone saw it, hidden by the very system designed to check the readings.
Code has its own checking systems. A thousand passing tests can confirm a developer’s understanding so thoroughly that nobody questions whether that understanding was correct. The anomaly doesn’t register as a failure. It becomes part of the record.
A different map
Rewind 130 years. In 1854, cholera was killing hundreds in London’s Soho and nobody could identify the source. The prevailing theory blamed bad air.
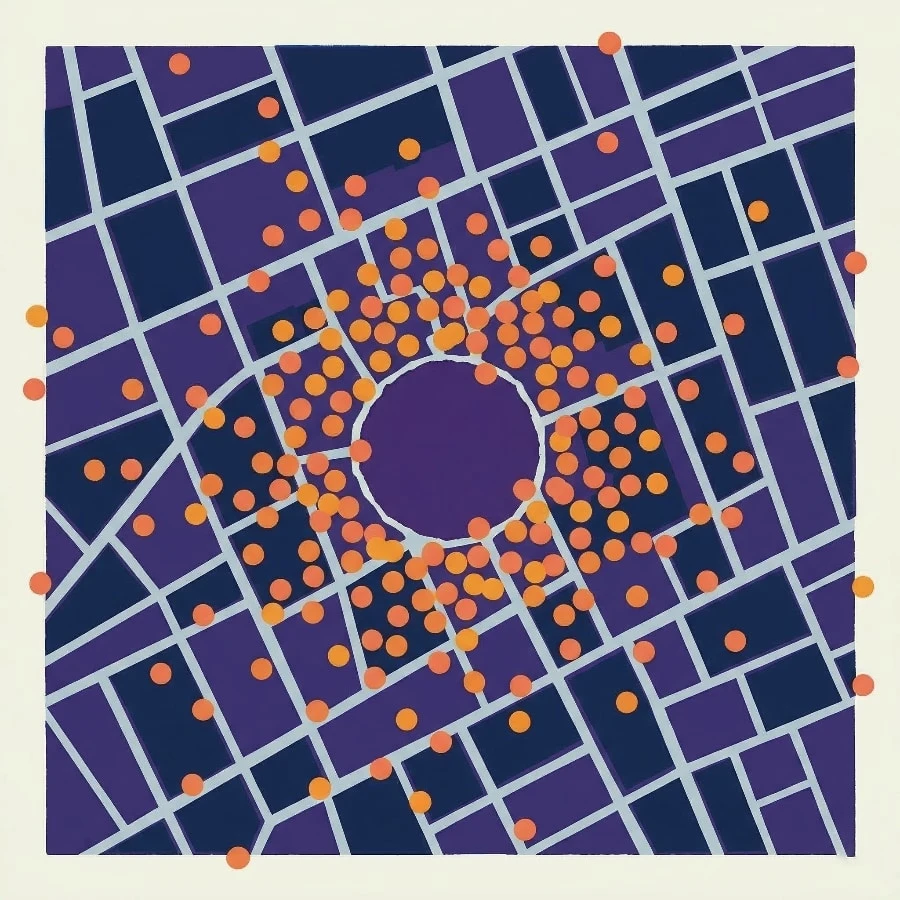
John Snow took the same data everyone else had, deaths and addresses, and drew a different map: plotting cases by location instead of charting streets and buildings. He didn’t discover new facts about the city. He represented existing information from a different vantage point, and the overlay made explicit what was latent in the original data: cases clustering around a single contaminated pump on Broad Street. The street maps weren’t wrong, they just couldn’t show what they weren’t designed to measure.
Two ways for information to hide in plain sight: nobody looks at it from the right angle, or the system designed to check it filters it out. Snow’s London had the first problem. The ozone data had the second. Software has both.
Code is a map. It charts implementation: how to calculate this value, where to store that result. Tests are a second map: given this input, produce that output. Both are accurate as far as they go. Neither asks the question that reveals the pattern underneath.
A developer reads row.get("fund_code", "Unknown") and thinks “this gets the fund code”. Their domain model says tickets identify entities, so of course the fund code is in the row. It isn’t. Every developer carries two models simultaneously, what the business needs and what the code does, and translates between them so fluently that the gap becomes invisible. The gap between the two models is where bugs live.
Code and tests are both drawn from this same vantage point: the developer’s understanding. When they agree, they can confirm a shared assumption rather than the underlying truth. A behavioural specification can serve as a different kind of map: a chart of purpose drawn from a vantage point neither code nor tests occupy, articulating what the code already contains. It builds a model of what the system should do, then checks whether the code delivers.
Calibrating the map
I wanted to test the theory against production code I’d never seen. The codebase was fifty thousand lines of Python, a thousand tests, all passing, built by a single developer over hundreds of commits for a financial services firm. The tool was Allium, a specification language we’ve been developing for LLM-driven work. I’ve used it before to design systems from scratch, but this was the opposite direction: distilling specifications from existing code, then overlaying the purpose map on the implementation map to see where they disagreed.
The process started by reading the codebase and inferring its behavioural contracts: what each component promises and what it expects from the components around it. Claude wrote the first five specification files in about twenty minutes, covering the domain model, data pipeline, quality checks, workflows and analytics.
Then I checked the specs against the code. They were wrong in thirty places.
Enum values that didn’t match stored data. Quality checks described as continuous that actually ran on demand. Two descriptions of the same calculation that sounded interchangeable but meant completely different things. Getting the spec wrong and being corrected was itself a form of investigation, each discrepancy marking a place where a first reading had been plausible but wrong.
I ran the verification more than once. The second pass caught things the first had missed. Ten specification files in total, checked and rechecked, until the two maps were aligned enough to overlay.
What the overlay showed
Isaac Asimov called “That’s funny…” the most exciting phrase in science. The corrections had been routine calibration. What came next was a series of “that’s funny” moments.
One part of the system compiled a summary of problems. Another part was supposed to read that summary and raise alerts. On the specification’s map, a connected flow: compile, read, generate tickets. On the code’s map, the connection was missing. The alerts ran on every invocation, found nothing, and moved on quietly. Dead on arrival.
Another part of the system generated tickets for statistical outliers, each naming the entity it flagged. The name was in the data, but the code reached for it in the wrong place, like opening a letter to find the sender’s address instead of checking the envelope. Every ticket said “Unknown”.
Six bugs in total, all following the same shape: ordinary logic errors, the kind unit tests exist to catch. They survived a thousand passing tests because nobody had drawn the map that would make them visible.
The confirmed reading
Then I found something more unsettling: tests that endorsed the wrong answer.
A function asks: what proportion of daily changes exceeded a threshold? To find changes, it compares each day’s value to the previous day’s. But the first day has no predecessor, producing a phantom, a placeholder that was never a real measurement. When the function counts large changes, the phantom is correctly ignored. But when it calculates the proportion, the phantom is included in the total, silently diluting the result. For five observations where every genuine change exceeds the threshold, the function reports 80% instead of 100%.
def volatile_ratio(series, limit):
    moves = diff(series)           # [null, 30, -25, 40, 15]
    large = abs(moves) > limit
    return large.mean()

assert volatile_ratio([200, 230, 205, 245, 260], 10) == 0.8  # passes
The developer saw 80%, judged it plausible, and wrote a test that agreed. The test has passed on every run since. Two more tests elsewhere in the suite exhibited the same phenomenon: the test didn’t miss the bug, it endorsed it.
The developer wanted the proportion of large moves. The phantom changed what “proportion” meant without anyone noticing. From the developer’s perspective, 80% looked right. Code and test, drawn from that same vantage point, reinforced each other.
The ozone instruments over Antarctica were the mirror image. Their software rejected a genuine reading as a measurement error; these tests accepted a measurement error as a genuine reading. Testing researchers call this the oracle problem: the test’s oracle is the developer’s own mental model, and that model is exactly what’s incomplete. The checking system detected the anomaly and filed it as expected behaviour.
A different vantage point
“This looks like an alerting system. Alerts should carry identifiers. Where’s the identifier?” A senior engineer reviewing unfamiliar code builds a model of purpose and measures the code against it. It’s model-based reasoning, and distilling a specification externalises exactly this process.
You read the system, infer its purpose and state that purpose in its own language, separate from the code, precise enough to verify. The specification says “report the proportion of real changes exceeding the threshold”. The code says something subtly different. The gap between those two statements is where the bug lives, and the test can’t see it because the test was drawn from the same vantage point as the code.
The hypothesis held. Six bugs in a few hours, three endorsed by passing tests, from a codebase I’d never seen, with no documentation and no access to the developer. Like Snow’s cholera map, the specification didn’t add new information to the city. It made explicit what was latent in the code, then showed where the implementation fell short of its own intent.
Areas of the system remain unexamined, and the approach is untested at scales larger than a single context window. But the mechanism is clear: draw a different map, overlay it on the existing one, and the places where the readings diverge from intent become visible.
Every codebase has instruments designed to check its readings, but few have a map drawn from a different vantage point.
If you’d like to see your systems from a different vantage point, we’d welcome a conversation.